Tag: customer segmentation

  • How to Write for Different Customer Avatars: 7 Proven Strategies That Drive Results

    How to Write for Different Customer Avatars: 7 Proven Strategies That Drive Results

    Customer avatar marketing works when the avatar changes a real buying decision—not when it merely gives the customer a fictional name, stock photo, age, and favorite coffee order. If two customer groups need the same promise, proof, objection handling, and next step, they probably do not need two versions of the copy. If their triggers, risks, decision criteria, authority, or required evidence differ, the message may need to change.

    That is the practical job of writing for different customer avatars: keep the offer and brand truth coherent, then vary only the parts of the message that evidence says matter. This guide shows you how to do that with seven strategies and the Scope Design DELTA Avatar Test: Decision difference, Evidence, Language, Treatment, Assess.

    What is a customer avatar—and what is it actually for?

    A customer avatar, sometimes called a buyer persona, is most useful as a human-readable summary of a recurring buyer pattern. It can help a writer remember the situation, motivations, objections, knowledge, constraints, and decision criteria that repeatedly show up in real customer evidence.

    It is not proof that the pattern exists. A polished persona document can still be a beautifully formatted guess.

    If you are still trying to determine who the audience is, start with our guide to identifying your target audience. If the underlying evidence is weak, use market research before turning assumptions into copy. This article begins one step later: you already have plausible customer patterns, and now you need to decide what the writing should do differently.

    The rule: change the copy only when the decision changes

    A detail belongs in an avatar only if it helps someone make a better marketing, sales, product, service, or content decision. Demographics can matter. So can job titles, channels, company size, technical skill, purchase history, or geography. The question is not whether the attribute is available. The question is whether knowing it changes what you should say or do.

    Observed differenceDoes the copy need to change?Why
    Different age bracket, same problem and buying criteriaUsually noAge alone does not establish a different decision.
    Owner wants business-risk proof; technical lead wants implementation proofProbablyThe evidence required to say yes is different.
    Same buyer is Problem Aware on one visit and Product Aware laterYes, but this is an awareness changeThe person may be the same avatar while needing a different message.
    Two segments use different words for the same underlying problemPossiblyLanguage can change recognition even when the offer stays the same.
    One segment needs a quote; another needs internal approval material firstYesThe next useful action is different.

    This keeps customer avatar marketing from becoming a personalization costume. The goal is not to prove that you know trivia about the customer. The goal is to make the decision easier for the right person.

    Use the Scope Design DELTA Avatar Test before writing variants

    Before you create a second headline, landing page, email sequence, sales deck, or CTA, run the proposed difference through DELTA.

    1. D — Decision difference: What buying decision, risk, objection, authority level, or next step is materially different for this group?
    2. E — Evidence: What customer interviews, sales conversations, CRM patterns, support records, search behavior, lost deals, purchase data, or other observations support that difference?
    3. L — Language: What words, problem descriptions, questions, objections, and proof requests does this group actually use?
    4. T — Treatment: What exactly should change in the copy—problem framing, proof, detail, objection handling, CTA, page route, or something else?
    5. A — Assess: What outcome will tell you to keep, revise, or stop the variation?

    If you cannot answer D or E, do not rush to T. You do not have a personalization brief yet. You have a hypothesis that needs research.

    7 strategies for writing to different customer avatars

    1. Start with evidence, not a fictional biography

    Persona exercises often begin with fields because fields are easy to fill in: age, income, hobbies, personality, preferred platform, maybe a name like “Marketing Mary.” The document feels complete because every box contains something. That does not mean the information changes the copy.

    Start instead with recurring evidence:

    • What event makes the problem urgent?
    • What did good customers try before contacting you?
    • Which reasonable objections repeat in sales conversations?
    • What proof do buyers ask for before committing?
    • Who has authority to approve the purchase?
    • Which constraints disqualify an otherwise interested lead?
    • What language do customers use before they learn your industry’s terminology?
    • What do lost deals reveal about price, trust, timing, fit, or alternatives?

    Use that evidence to build the avatar. Do not use the avatar to manufacture evidence. Scope Design’s buyer psychology guide can help when you need to examine motivations, perceived risk, confidence, and decision friction in more depth.

    2. Choose a primary copy audience by decision value—not an arbitrary majority rule

    The old version of this article recommended choosing an avatar that represents roughly 60–80% of ideal customers. That sounds decisive, but the percentage is not a useful universal rule. Your highest-priority audience may be smaller and still matter more because it is a better service fit, has buying authority, produces healthier economics, or represents the direction the business is intentionally moving.

    Choose the primary audience for a page by asking:

    • Which segment has the strongest evidence of a real problem we solve well?
    • Which segment is serviceable with our current capacity and offer?
    • Who has enough authority and urgency to act?
    • Which customers tend to be a healthy economic fit rather than merely easy to attract?
    • Which segment matches the page’s specific search, campaign, referral, or sales job?
    • Which audience is the business deliberately trying to grow?

    “Primary” means the page needs a clear default reader. It does not mean every other customer is unwelcome. If a secondary buyer can still understand the offer and find the relevant proof or next step, one page may serve both.

    3. Define the message delta before you draft a second version

    The fastest way to create inconsistent multi-avatar copy is to tell a writer or AI tool, “Rewrite this for Persona B.” That invites surface-level changes in tone, vocabulary, and stereotypes without defining what actually differs.

    Create a message-delta sheet first:

    Message elementUsually stays stableMay change by avatar
    Core offerWhat you actually sell and deliverEmphasis on the most relevant use case
    Brand promiseThe truthful value the business stands behindWhich consequence or benefit is foregrounded
    Problem framingThe underlying problem categoryTrigger, urgency, symptoms, language
    ProofOnly evidence you can substantiateWhich case, credential, process detail, or example is most relevant
    ObjectionsTruthful limitations and tradeoffsWhich concern gets addressed first
    DepthAccuracyTechnical detail, context, comparison depth
    CTAA legitimate next stepQuote, demo, consultation, guide, internal-review asset, or another action that fits readiness

    This approach also makes copywriting formulas more useful. A formula can organize an argument, but the avatar evidence should determine which problem, proof, objection, and action belong inside that structure.

    4. Separate awareness level from avatar identity

    A common mistake is treating “unaware,” “problem aware,” “solution aware,” “product aware,” and “most aware” as five customer personas. They are not. Awareness describes what the buyer currently knows about the problem, available solutions, and your offer. The same person can move through several awareness states over time—or arrive already informed because of a referral.

    That gives you two useful axes:

    • Avatar: recurring characteristics of the buyer situation that affect the decision.
    • Awareness: what that buyer currently understands and therefore needs from the message now.

    A third axis can matter too: market sophistication, or what the market has already heard, tried, or learned to distrust. Keep these concepts separate. Otherwise you end up with a persona spreadsheet that mixes identity, funnel stage, category maturity, and channel into one unhelpful blob.

    5. Change proof and objection handling before you reinvent the brand promise

    Different buyers often need different reasons to believe the same truthful promise.

    A business owner evaluating a website project may care first about business risk, timeline, total investment, and whether the project will create a clearer route to qualified inquiries. A marketing manager evaluating the same firm may care first about collaboration, stakeholder approvals, analytics continuity, content migration, and whether their team can maintain the site after launch.

    The service does not need to become two different companies. The evidence sequence changes.

    This is also where restraint matters. In the United States, the FTC’s advertising guidance says advertising claims should be truthful, non-deceptive, and evidence-based. If Persona A would be persuaded by a dramatic performance claim you cannot support, the solution is not to hide the claim from Persona B. The solution is to stop making it.

    6. Split pages only when the decision path materially diverges

    Not every avatar deserves a separate landing page. Creating a page for each persona can produce duplicated copy, thin search intent, messy navigation, extra maintenance, and competing URLs that all sort of answer the same question.

    A separate page becomes easier to justify when several of these are true:

    • The segment has a genuinely different problem or buying trigger.
    • The offer, package, eligibility, implementation, or pricing logic materially differs.
    • The buyer needs different proof or has different regulatory, technical, or operational constraints.
    • The search or campaign intent is distinct enough that one page would confuse both groups.
    • The CTA or conversion path is different.
    • You can maintain enough unique, useful content to make the page worth existing.

    If only one or two message elements differ, layer the information on the same page: a role-specific proof block, a short comparison, an FAQ, a secondary CTA, or a link to deeper detail. The broader small business marketing strategy still needs one coherent handoff from audience to message to destination to measurement.

    7. Test one meaningful difference at a time

    Avatar-based copy becomes unmeasurable when the team changes the headline, hero image, offer, proof, form, CTA, price presentation, traffic source, and follow-up sequence at the same time. If results change, nobody knows why.

    Write a bounded hypothesis instead:

    For this evidence-backed segment, changing this one meaningful message factor should improve this qualified business outcome because this customer evidence suggests the current version is creating friction.

    Then define the comparison, observation window, guardrails, and what would make you keep, revise, or stop the variation. That is consistent with the logic of experimental design described by NIST: deliberately vary factors and observe the response rather than changing everything and reverse-engineering a story afterward. Scope Design’s growth marketing framework covers the broader experiment loop.

    Low traffic changes the method, not the need for evidence. A small business may not have enough volume for a clean conventional A/B test. You can still compare qualified lead rate by source or segment, tag sales opportunities, review call notes, run moderated user tests, compare sequential message periods cautiously, or use interviews to investigate why a version is clearer. Do not manufacture statistical certainty because the dashboard offers a percentage.

    A worked example: two avatars, one website service

    This is a hypothetical example to show the decision process, not a client results case.

    Imagine a web design firm sells the same strategic website engagement to two recurring buyer patterns:

    • Owner-led buyer: the founder is directly responsible for revenue and has lost confidence in the current site.
    • Marketing-led buyer: a marketing manager owns the project internally but needs stakeholder approval and a dependable implementation process.
    DELTA fieldOwner-led buyerMarketing-led buyer
    Decision difference“Is this worth the investment, and will it fix a real business constraint?”“Can I get this approved and delivered without creating another internal mess?”
    EvidenceSales calls repeatedly surface lead quality, cost, risk, and timeline.Discovery calls repeatedly surface migration, approvals, analytics, collaboration, and maintainability.
    LanguageQualified leads, investment, timeline, ownership, business outcome.Stakeholders, migration, handoff, analytics, governance, workflow.
    TreatmentLead with diagnosis, investment logic, business proof, and project risk.Lead with process, collaboration, technical continuity, and internal handoff proof.
    AssessQualified consultation rate and sales acceptance.Qualified consultation rate, stakeholder progression, and sales acceptance.

    The core promise remains truthful and consistent. The page does not suddenly become playful for owners and corporate for marketers because a persona worksheet said so. The copy changes where the buying decision changes.

    Where AI helps with customer avatar copy—and where it does not

    AI can be useful once the evidence and message delta are defined. It can generate headline variations, adapt a proof block to a different decision-maker, shorten or expand technical detail, compare drafts against a brief, or produce channel-specific versions of the same approved message.

    AI should not be asked to invent the customer evidence that justifies the variation. “Create three realistic personas for my plumbing company” can produce tidy fiction. It cannot tell you whether those groups actually differ in urgency, economics, objections, or buying behavior in your market.

    A safer workflow is:

    1. Supply verified segment evidence and mark unknowns.
    2. State the stable offer and claims that may not change.
    3. Define the DELTA fields for each segment.
    4. Ask for variations only within those constraints.
    5. Review every factual, performance, legal, pricing, and proof claim.
    6. Test the useful differences rather than publishing every variation the model can generate.

    That turns AI into a drafting multiplier instead of a stereotype multiplier.

    What should you measure across customer avatars?

    Measure the consequence the business actually cares about, then use intermediate metrics to diagnose the path. Useful measures can include qualified inquiry rate, sales acceptance, booked consultation rate, purchase rate, average order value, renewal or repeat purchase, close rate, or another outcome appropriate to the offer.

    Three cautions matter:

    • Do not compare segments you cannot identify reliably. A made-up dashboard segment creates made-up confidence.
    • Do not confuse channel differences with avatar differences. Search traffic and social traffic may behave differently even when the buyer pattern is similar.
    • Do not promote a proxy into the final business outcome. Time on page, clicks, or scroll depth can help diagnose behavior; they do not prove that the message attracted a better customer.

    When customer value is part of the prioritization decision, define it carefully and avoid turning an optimistic lifetime-value forecast into permission to overspend on acquisition.

    What we learned by auditing this exact article

    We applied the same evidence rule to this revision instead of protecting old copy because it already existed. For the 12 complete months ending July 31, 2026, this URL recorded eight GA4 landing sessions total, including one Organic Search session, and zero key events. Search Console returned no query rows for the URL in the current or prior comparison period and currently reports the URL as unknown to Google. Bing recognizes the page and has crawl history, but its URL traffic report shows zero clicks and zero impressions.

    That tiny sample does not prove the topic is bad, that readers disliked the page, or that this revision will improve rankings. It supports a narrower decision: the legacy article did not have a meaningful search or business-performance footprint that justified preserving unsupported statistics and weak ownership. We kept the established URL because it is live, self-canonical, and index/follow; we changed the content job instead.

    Customer avatar copy implementation checklist

    • Define the business decision this page or campaign must influence.
    • Confirm the avatar is based on recurring evidence, not a completed template.
    • Choose one clear primary reader for the page.
    • Run DELTA for every proposed secondary segment.
    • Write down what stays stable: offer, truthful claims, brand promise, important limitations.
    • Write down what may change: trigger, problem language, proof, objections, depth, CTA, route.
    • Check awareness level separately from avatar identity.
    • Create a separate page only when the decision path is materially different.
    • Use AI only after the evidence and constraints are supplied.
    • Define a qualified outcome and a keep/revise/stop rule before testing.
    • Record what the test actually taught you and update the avatar when evidence changes.

    Frequently asked questions about customer avatar marketing

    What is the difference between a customer avatar and a buyer persona?

    In everyday marketing use, the terms often overlap. Both can describe a recurring customer pattern for writing, creative direction, and sales enablement. The more important distinction is between a persona/avatar and the evidence behind it. A persona is a summary; it is not proof that the segment is real.

    How many customer avatars should a business have?

    There is no universal correct number. Keep only the avatars that change a meaningful decision. If two profiles produce the same offer, message, proof, objections, and CTA, combine them or treat the difference as descriptive rather than strategic. If a segment has a materially different buying path, it may deserve its own avatar and possibly its own page.

    How do I choose my primary customer avatar?

    Choose the default audience for the specific page or campaign based on evidence of problem fit, serviceability, authority, urgency, economics, strategic priority, and the page’s job. The biggest segment is not automatically the best primary segment.

    Should every customer avatar get a separate landing page?

    No. Split the page when the problem, offer, proof, constraints, search intent, or next step diverges enough that one page becomes confusing. If the difference is limited to one proof block, objection, example, or CTA, a layered page is often easier to maintain and clearer for readers.

    Is awareness level the same thing as a customer avatar?

    No. An avatar describes a recurring buyer pattern. Awareness describes what the buyer currently knows about the problem, solution category, and your offer. The same avatar can be Problem Aware today and Product Aware later.

    Can I use AI to write for different customer avatars?

    Yes, but give the model evidence and constraints first. AI is useful for drafting controlled variations; it is not customer research. Require it to preserve approved claims and the stable offer, then vary only the message elements supported by the DELTA brief.

    How do I test avatar-specific copy if my website has low traffic?

    Do not force a high-volume A/B testing model onto a low-volume business. Use the strongest evidence available: qualified inquiry tagging, sales acceptance, call notes, interviews, moderated tests, carefully controlled sequential comparisons, and CRM outcomes. Treat small samples as directional evidence, not statistical certainty.

    Write for the decision, not the persona costume

    Different customer avatars can justify different copy, but the difference needs a reason. Start with evidence. Choose a clear primary reader. Define the message delta. Keep awareness separate from identity. Change proof and objections before reinventing the brand. Split pages only when the buying path splits. Test one meaningful difference at a time.

    If your marketing is trying to speak to several valuable customer types and every revision turns into “make it more personal,” Scope Design can help map the audience, message, page ownership, and conversion path before more copy gets produced. Contact Scope Design to start with the decision the message needs to improve.


  • How to Identify Your Target Audience and Find Them Online: Complete Guide

    How to Identify Your Target Audience and Find Them Online: Complete Guide

    If you want to know how to identify your target audience, start by replacing demographic guesses with evidence. If your target audience is “women ages 25–44 who use Instagram,” you do not have an audience strategy yet. You have a demographic filter. A useful target audience explains who has the problem, what makes it matter now, what affects the buying decision, and where that person shows behavior you can actually observe and reach.

    That distinction matters because demographic data can help you form a hypothesis, but it cannot tell you by itself why someone buys, what they tried first, what they distrust, or which message will move them. The best audience definition is not a fictional character you invent once. It is a testable hypothesis that gets sharper as real evidence comes in.

    What is a target audience?

    A target audience is the specific group of people or organizations you are trying to reach because they have a meaningful reason to care about your offer and are plausible customers for it. A strong definition combines the problem they face, the trigger that creates urgency, relevant constraints, decision criteria, and the places where they search, compare, learn, ask, or return.

    For a small business, that is more actionable than a sentence built only from age, gender, income, and interests. Those attributes can still matter. The question is whether they change a real business decision.

    • Keep an attribute if it changes your message, offer, eligibility, price sensitivity, serviceability, buying authority, channel, or follow-up.
    • Question an attribute if it is merely easy to collect.
    • Drop an attribute if knowing it would not change what you do.

    The U.S. Small Business Administration makes a similar practical distinction in its market-research guidance: broad sources can help answer general, quantifiable questions about a market, while direct customer research is better suited to questions specific to your business and customers.

    How to identify your target audience: use the TRACE method

    At Scope Design, a useful audience definition has to survive contact with evidence. We use a simple framework for that: TRACE — Trigger, Reality, Attributes, Channels, Evidence.

    T — Trigger: what makes the problem matter now?

    Start with the event that turns a general need into an active problem. Someone may “care about cybersecurity” for years but only shop for help after an insurance requirement, a client security questionnaire, an employee mistake, or a near miss. A homeowner may vaguely want a new kitchen until a leak, new baby, home sale, or financing decision creates a deadline.

    Triggers are valuable because they expose timing, urgency, language, and search behavior. Ask:

    • What happened right before this became important?
    • What would make the buyer act this week instead of “someday”?
    • What happens if they do nothing?
    • Who else becomes involved once the trigger occurs?

    R — Reality: reconstruct what people actually did

    Do not begin by asking customers what they “would” do. Reconstruct the last real episode. Ask what happened, what they searched for, who they talked to, what alternatives they considered, what they rejected, what nearly stopped them, and why they finally chose one path.

    This is where audience research becomes useful marketing intelligence. The phrases customers use to describe the problem can shape your website, SEO, sales conversations, and content. The alternatives they considered reveal the real competitive set—which may include doing nothing, hiring internally, using a spreadsheet, asking a friend, or choosing a cheaper category.

    If you want a deeper menu of research techniques, use our guide to self-directed market research. This article stays focused on what evidence you need to define and locate an audience.

    A — Attributes: keep only the differences that matter

    Now add attributes that explain meaningful differences between buyers. Depending on the business, those might include geography, company size, job role, life stage, technical maturity, purchase frequency, budget authority, urgency, risk tolerance, or previous solution.

    Demographics can be useful here, but treat them as clues rather than conclusions. Pew Research Center’s U.S. social-media data, for example, shows that platform adoption differs substantially across age and other demographic groups. That is useful for generating a channel hypothesis. It still does not prove that your best customers use a platform to solve your problem.

    C — Channels: find the behavior, not just the person

    The question “Where does my audience hang out online?” is often too vague. People use different channels for different jobs. The same owner might search Google for an urgent vendor, watch YouTube to understand a technical problem, ask peers in a private group for recommendations, use LinkedIn for professional discovery, and ignore promotional posts everywhere else.

    Map channels to the behavior you need to reach:

    Audience behaviorPlaces to investigateEvidence to look for
    Actively searching for a solutionGoogle, Bing, local search, marketplacesSearch queries, local terms, comparison language, “near me” or problem-specific searches
    Learning how a problem worksYouTube, search, podcasts, expert newslettersRepeated questions, tutorials, explainers, terminology gaps
    Comparing vendors or approachesReview sites, Reddit, forums, industry groups, searchObjections, alternatives, price questions, trust signals, recommendation threads
    Professional discoveryLinkedIn, associations, trade publications, webinarsJob roles, industry language, events, peer commentary
    Visual discovery or inspirationInstagram, TikTok, Pinterest, YouTubeSaves, shares, creator formats, before/after examples, recurring visual themes
    Already knows youEmail, CRM, remarketing audiences, direct trafficRepeat visits, email clicks, prior purchases, form activity, sales-stage behavior

    E — Evidence: confirm or kill the hypothesis

    Your first audience definition should be written in a way that can be disproved. For example:

    “We believe independent dental practices with 5–20 employees become active website buyers when growth stalls or the site creates trust problems. The owner or practice manager researches options through search, peer recommendations, and vendor examples. They need clear proof of process, local credibility, and ongoing support before they will consider a higher-priced partner.”

    That statement gives you something to test. If interviews show the trigger is actually a practice acquisition, if the office manager never participates, or if referrals dominate search, change the definition. Evidence wins.


    Target audience vs. target market, ICP, and buyer persona

    These terms overlap, but they do different jobs. Keeping them separate prevents the common mistake of treating a detailed persona as proof that the audience is real.

    TermWhat it describesBest use
    Target marketThe broader market your business could realistically serveMarket sizing, positioning, business strategy
    Target audienceThe specific people or organizations you want a message, offer, or campaign to reachMarketing strategy, messaging, channel choice
    ICPThe type of customer/account that is an especially strong fitB2B qualification, sales prioritization, account selection
    Buyer persona/avatarA human-readable summary of a recurring buyer patternWriting, creative direction, sales enablement—after evidence exists

    Once your audience evidence is solid, our guide to writing for different customer avatars can help you turn that evidence into more specific copy. And if you need to go deeper on motivations, risk, objections, and decision patterns, see our buyer psychology guide.

    How to research your target audience if you already have customers

    If you already have customers, your fastest path is not a new persona workshop. Start with what your business already knows.

    1. Rank customers by business value—not familiarity

    Pull a simple customer list and mark revenue or project value, repeat purchases, margin if known, fit, retention, sales effort, support burden, referral behavior, and whether the work is the kind you want more of. Your “most memorable” customers are not always your best market.

    2. Interview a small mix of wins, losses, and ideal-fit customers

    Ask about the last real buying episode. What triggered it? What did they do first? What did they search? What other choices did they consider? Who was involved? What made them skeptical? What evidence mattered? Why did they choose you—or choose someone else?

    Five useful conversations can expose language and decision patterns that a spreadsheet cannot. The goal is not statistical certainty; it is to discover hypotheses worth checking across more evidence.

    3. Review sales, support, reviews, and search language

    Look at contact-form submissions, sales notes, proposals, support tickets, reviews, on-site searches, Search Console queries, and frequently asked questions. These sources often reveal the gap between the words a business uses internally and the words customers use when the problem is real.

    4. Use analytics as a clue, not a census

    Analytics can show acquisition channels, landing pages, devices, geography, repeat behavior, and conversion paths. But be careful treating any analytics demographic view as a census. Google’s Analytics Data API guidance notes that reports can be subject to data thresholding to prevent identification of individual users based on demographics, interests, or other signals, and rows with small user counts may be excluded. See Google’s reporting data expectations.

    If the CRM says your strongest customers are multi-location service businesses but a small GA4 demographic card says most visible users fall into one age bracket, do not rewrite your strategy around the age bracket. Follow the evidence closest to the buying decision.

    How to identify a target audience when you are starting from zero

    No customers yet? You can still create a useful starting hypothesis. You just need to label assumptions as assumptions.

    1. Define the painful problem. Be specific enough that a person would recognize the situation.
    2. List likely triggers. What event would make someone start looking now?
    3. Map alternatives. Include competitors, DIY, internal workarounds, postponement, and “do nothing.”
    4. Find real conversations. Read reviews, niche forums, Reddit threads, trade communities, video comments, competitor FAQs, and search suggestions for recurring language and objections.
    5. Talk to plausible buyers. Do not pitch. Ask about past behavior around the problem.
    6. Create two or three competing audience hypotheses. Avoid falling in love with the first one.
    7. Run a small test. A landing page, outreach batch, search campaign, referral experiment, webinar, or content piece can reveal which hypothesis produces qualified action.

    This is where broader small-business marketing strategy matters: the audience is one part of the system. A weak offer, confusing page, wrong proof, or poor follow-up can make a good audience look bad. Diagnose the whole path before declaring that “the audience didn’t work.”

    How to find your target audience online

    Do not ask only, “Which platform has people like my customer?” Ask, “Where does my customer perform the behavior that matters to this decision?”

    Search engines: capture active demand

    Search is strongest when people can describe the problem, category, location, or desired outcome. Review Google Search Console, keyword research, autocomplete, related searches, local listings, and competitor rankings. Pay attention to the words that signal intent: pricing, comparison, reviews, “best,” “near me,” specific symptoms, or a named solution.

    Social platforms: investigate behavior before demographics

    Platform demographic studies can tell you whether a hypothesis is plausible. Then inspect the actual community. What does the audience follow? Which formats do they save or share? What questions recur? Which creators, associations, brands, or peers do they trust? Is the platform used for discovery, education, entertainment, professional identity, or purchase research?

    The right answer may be “use TikTok for discovery but search for conversion,” or “LinkedIn is good for credibility but referrals drive the actual shortlist.” A channel does not have to perform every job.

    Communities and forums: mine objections and language

    Reddit, specialist forums, Facebook or LinkedIn groups, Slack communities, trade groups, and association discussions are often better for learning than broadcasting. Search for problem phrases, alternatives, vendor frustrations, and “what would you recommend?” threads. Treat community posts as qualitative evidence, not a representative sample of the whole market.

    Your own CRM and email list: study first-party behavior

    Existing contacts can reveal which industries, service lines, lead sources, pages, emails, offers, or follow-up sequences correlate with real revenue. A small but verified customer pattern is often more useful than a huge third-party audience estimate.

    Use an audience evidence ladder

    Not all audience signals deserve equal weight. When sources disagree, prefer evidence closer to the real buying decision.

    Evidence levelExamplesWhat it can tell youMain limitation
    1. Transaction / outcomePurchases, retained clients, qualified leads, won/lost dealsWho actually creates business valueMay reflect your current reach, not the whole opportunity
    2. Observed behaviorSearch queries, page paths, repeat visits, email clicks, sales-stage actionsWhat people doBehavior still needs context
    3. Direct qualitative evidenceInterviews, sales notes, reviews, support conversationsTriggers, language, alternatives, objectionsSmall samples can overrepresent strong opinions
    4. Market / community evidenceIndustry data, competitor reviews, communities, Pew/SBA dataMarket plausibility, context, hypothesesUsually not specific to your customers
    5. AssumptionsBrainstorms, persona guesses, stereotypesA starting hypothesisNot evidence until tested

    The ladder does not mean a single purchase proves a market. It means verified outcomes deserve more weight than a generic claim such as “people over 50 prefer Facebook” when you are deciding who to pursue and how.

    When should you create multiple target audiences?

    Most businesses have more than one plausible audience. The mistake is either targeting everyone with one vague message or creating so many segments that no one can act on them.

    Create a separate audience when the difference changes at least one meaningful decision:

    • the problem or trigger;
    • the value proposition;
    • the proof required;
    • the buying authority or sales process;
    • the economics or service model;
    • the channel or search behavior;
    • the follow-up sequence.

    For example, a commercial HVAC company may need separate audiences for facility managers with planned maintenance budgets and property owners facing emergency failures. The company is the same; the trigger, urgency, message, proof, channel mix, and sales path are not.

    A 30-day target audience validation sprint

    You do not need six months of research before making a decision. You need a controlled loop that creates better evidence.

    WeekActionOutput
    1Write 2–3 TRACE audience hypotheses and gather existing first-party evidenceA one-page hypothesis for each audience, with unknowns clearly marked
    2Interview 5–8 relevant people across customers, prospects, or plausible buyersTriggers, language, alternatives, objections, channel clues
    3Run one small channel/message test per leading hypothesisComparable data on qualified response—not just impressions
    4Score the evidence and decide: scale, revise, or stopA narrower audience definition and the next test

    Choose a success measure that matches the business: qualified calls, booked consultations, quote requests, trials, purchases, or another real step. Cheap clicks can be useful diagnostic data, but they are not proof of audience fit.

    A simple decision rule keeps the test honest:

    • Scale when the audience produces qualified behavior and the interviews support the same trigger/message/channel pattern.
    • Revise when interest exists but the trigger, message, proof, or channel is wrong.
    • Stop when repeated evidence shows weak need, poor economics, low authority, or no reachable path.

    Common target audience mistakes

    Mistake 1: targeting “everyone”

    If everyone is a customer, your message cannot prioritize a problem, trigger, proof point, or channel. Start narrower. You can expand after you learn what works.

    Mistake 2: treating demographics as motivation

    Two people of the same age and income can have completely different problems, constraints, risk tolerance, authority, and buying triggers. Demographics can sharpen a segment; they should not substitute for behavior and context.

    Mistake 3: inventing a persona before collecting evidence

    A name, headshot, favorite coffee, and made-up quote make a profile feel specific without making it true. First find recurring evidence. Then summarize it into a persona if that makes the team easier to align.

    Mistake 4: choosing a channel because a demographic is there

    Being present on a platform is different from using that platform for a buying task. Look for the behavior you need: search, education, comparison, recommendation, discovery, or re-engagement.

    Mistake 5: measuring attention instead of qualified outcomes

    Impressions, views, and clicks can show whether a message reached people. They do not prove you reached the right people. Connect the test to a qualified next step.

    Target audience FAQ

    How do I know who my target audience is?

    Start with the people or organizations that have the problem you solve, then identify the trigger, real buying behavior, meaningful attributes, and channels. Validate the definition against customers, interviews, first-party data, search/community evidence, and small tests. If the evidence disagrees with the definition, change the definition.

    How many target audiences should a business have?

    As few as you can use effectively. Create a separate audience when the difference changes message, offer, economics, authority, proof, channel, or follow-up. If nothing operational changes, the extra segment may be unnecessary.

    What is the difference between target audience and target market?

    Your target market is the broader market you can serve. A target audience is a more specific group you want a particular marketing message, offer, or campaign to reach.

    How can I find my target audience on social media?

    Use demographic data only as a starting hypothesis. Then inspect the behavior: creators followed, communities joined, questions asked, content saved or shared, recommendation threads, formats used, and whether the platform is part of discovery, education, comparison, or purchase. Confirm with first-party results before scaling.

    Can I identify a target audience without existing customers?

    Yes. Define the problem and likely triggers, research alternatives and real conversations, interview plausible buyers, create competing hypotheses, and run small tests. Just keep assumptions visibly separate from verified evidence.

    Turn audience research into a marketing decision

    The goal is not to produce the most detailed customer profile. It is to make better decisions about who you should pursue, what problem you should lead with, what evidence they need, where you can reach them, and what you should test next.

    If your marketing feels scattered, Scope Design can help connect audience research to positioning, website strategy, SEO, content, and campaigns. Contact Scope Design to talk through the constraint in your current marketing system and the evidence you need before spending more attention or budget.

  • Customer Lifetime Value: Calculate It Without Lying to Yourself

    Customer Lifetime Value: Calculate It Without Lying to Yourself

    Customer lifetime value (CLV) is the expected economic value a customer will create across a defined relationship window. For business decisions, calculate it from gross profit or contribution after the costs of serving that customer, not just revenue, and analyze it by cohort or customer segment. If the number does not change a decision, it is not strategy. It is spreadsheet cosplay with a dollar sign.

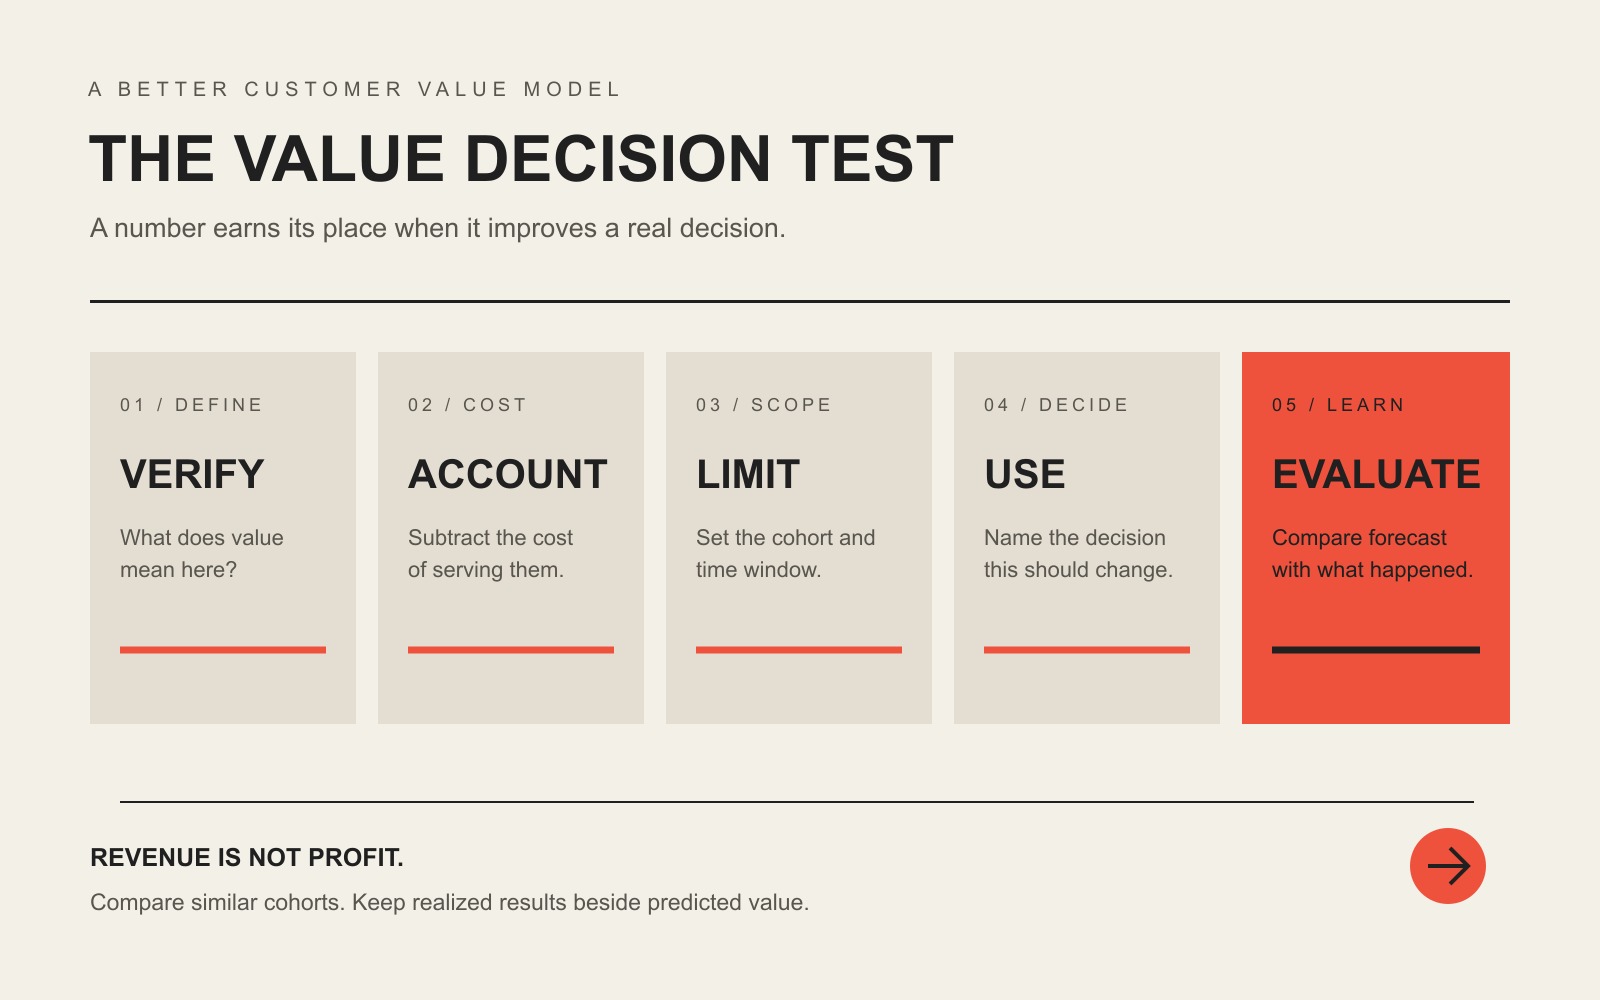
    TL;DR: Customer lifetime value should answer a specific question: how much can we afford to acquire this type of customer, which relationships deserve retention effort, what should we improve, or where are we losing margin? Use Scope Design’s VALUE Decision Test: Verify the definition, Account for costs, Limit the cohort and time window, Use it for a named decision, and Evaluate the forecast against actual results. Do not treat every customer as equally valuable, every dollar of revenue as profit, or a generic 3:1 CLV-to-CAC ratio as holy scripture.

    What is customer lifetime value?

    Customer lifetime value estimates the value of the future economic relationship between a business and a customer. You will also see it called CLV, customer LTV, CLTV, or simply LTV. In most business conversations, those labels point to the same family of ideas.

    The important distinction is not CLV versus LTV. It is revenue versus economic value.

    A revenue-based calculation asks how much the customer may buy. A profit-based calculation asks how much value remains after the costs required to deliver those purchases. Those are not the same number, especially for a service business.

    Academic customer-valuation research defines customer value around expected, discounted future earnings. The Journal of Marketing Research paper “Valuing Customers” used discounted future earnings to connect customer economics to firm value. Peter Fader and Bruce Hardie’s work also shows why customer heterogeneity and changing retention patterns matter: applying one aggregate retention rate to everybody can bias the estimate. Their paper, “Customer-Base Valuation in a Contractual Setting: The Perils of Ignoring Heterogeneity,” is a useful antidote to the fantasy that one tidy average describes a whole customer base.

    In plain English: different customers behave differently, cost different amounts to serve, and remain customers for different lengths of time. Your model should admit that before it starts issuing confident decimals.

    What is the customer lifetime value formula?

    There is no single universal CLV formula because businesses do not all earn money the same way. A coffee shop, subscription platform, project-based consultancy, managed-service provider, and equipment dealer have different purchase patterns, costs, and definitions of an active customer.

    Use the simplest model that is defensible for the decision.

    Simple revenue CLV formula

    For a repeat-purchase business:

    Revenue CLV = Average purchase value × Purchase frequency × Average customer lifespan

    This is easy to calculate and useful as a first look. It is also dangerously flattering because it counts revenue as though fulfillment were free.

    Gross-margin CLV formula

    A better planning estimate is:

    Gross-margin CLV = Average revenue per period × Gross margin percentage × Expected customer lifespan

    For a stable subscription business, a common shortcut is:

    Gross-margin CLV ≈ Average revenue per period × Gross margin percentage ÷ Revenue churn rate

    That shortcut assumes relatively stable revenue, margin, and churn. If those assumptions are nonsense for your business, the answer will be polished nonsense.

    Contribution-based CLV formula for service businesses

    For many service businesses, use:

    Contribution CLV = Sum of expected customer revenue − incremental delivery and service costs over the chosen window

    Customer-specific costs may include:

    • delivery labor;
    • materials and subcontractors;
    • payment processing;
    • travel;
    • customer-specific software or licensing;
    • onboarding and support labor;
    • account-management time;
    • refunds, credits, and revenue reversals.

    Then keep acquisition cost visible:

    Net customer value = Contribution CLV − Customer acquisition cost

    Do not dump every fixed overhead expense into a customer model just because accounting owns a large bucket. Do include costs that meaningfully rise when you acquire or serve that type of customer. The goal is a decision-quality number, not a theological debate between spreadsheet tabs.

    Revenue CLV versus profit CLV: a simple example

    Suppose two hypothetical service customers each produce $24,000 in revenue over two years.

    CustomerTwo-year revenueDelivery and support costContribution before CAC
    Customer A$24,000$9,000$15,000
    Customer B$24,000$18,000$6,000

    A revenue-only dashboard declares a tie. The business experiences two radically different relationships.

    Customer B may require excessive customization, repeated rework, more senior labor, slow approvals, and constant rescue. Customer A may follow the process, provide useful inputs, buy the right solution, and achieve a better outcome with less friction.

    This does not mean “fire every demanding customer.” It means do not confuse billing with value. A customer can produce impressive revenue while consuming margin, capacity, attention, and the team’s will to live.

    That is why the Scope Design customer lifecycle framework tracks fit, handoffs, outcomes, retention, and expansion as one operating system. Lifetime value is downstream of how the relationship actually works.

    The Scope Design VALUE Decision Test

    Before you use a CLV number, make it pass five gates.

    • V: Verify the value definition. State whether the model measures revenue, gross profit, contribution, or discounted future profit. Do not call all four “lifetime value” in the same meeting.
    • A: Account for acquisition and service costs. Include the costs that change with the customer relationship. Keep CAC separate enough to compare channels and offers.
    • L: Limit the cohort, segment, and time window. Define which customers the number describes and how far into the future you are willing to forecast.
    • U: Use it for a named decision. Write the decision before running the calculation: acquisition budget, retention effort, pricing, service design, segmentation, or forecasting.
    • E: Evaluate prediction against actual results. Compare forecast CLV with realized cohort contribution and update the model. A model that is never checked is a story wearing business-casual clothing.
    The VALUE Decision Test: Verify the definition, Account for serving costs, Limit the cohort and time window, Use the measure for a named decision, and Evaluate forecasts against actual results.
    The Scope Design VALUE Decision Test: Verify, Account, Limit, Use, and Evaluate

    Verify: What does “value” mean in this model?

    Put the definition at the top of the dashboard.

    Bad:

    CLV: $18,420

    Better:

    Predicted 24-month gross-margin CLV for U.S. managed-service customers acquired through referrals, before CAC: $18,420.

    The second version tells a decision-maker what the number includes, whom it describes, how long it looks forward, and whether acquisition cost has been deducted. It is less sexy and vastly more useful.

    Account: Which costs change because this customer exists?

    List the costs required to win, onboard, deliver, support, retain, and expand the relationship. For service businesses, labor is often the missing monster under the bed.

    If a $10,000 account requires $7,500 in labor, subcontractors, travel, credits, and support, its economic value is not $10,000. If a $7,000 account requires $1,500 in variable cost and produces a clean referral, the smaller account may be the stronger relationship.

    Referrals can matter, but do not casually add the imagined value of every friend a customer might someday mention. Track referred customers as their own acquisition source. Credit influence only when you can observe it.

    Limit: Which customers and what time period?

    An all-customer average can hide the decisions you need to make. Segment by factors that plausibly change economics:

    • acquisition source;
    • first product or service;
    • customer type or industry;
    • project size;
    • geography;
    • onboarding path;
    • contract structure;
    • start month or quarter;
    • service tier;
    • right-fit versus exception-heavy work.

    Use a time window your data can support. A 12-month realized contribution figure can be more useful than a five-year prediction built from nine months of history and several heroic assumptions.

    Use: What decision will change?

    Name the decision and its rule.

    Examples:

    • Increase paid acquisition only when the lower-bound contribution estimate covers CAC and required payback.
    • Invest in onboarding for cohorts whose early service cost is high but later retention and margin are strong.
    • Stop promoting an offer that produces revenue but attracts exception-heavy, low-margin customers.
    • Create a higher service tier when a defined segment needs more support and will pay for the capacity required.
    • Build a retention intervention for profitable customers showing an observable risk signal.

    “Put CLV on the dashboard” is not a decision. It is interior decorating for analytics.

    Evaluate: Was the forecast remotely right?

    At a fixed interval, compare predicted and realized results by cohort:

    • revenue;
    • contribution;
    • retention or repeat purchase;
    • service hours and cost;
    • refunds or credits;
    • expansion;
    • acquisition cost;
    • forecast error.

    Then change the model or change the business. Do not keep a flattering formula merely because leadership already put it in a slide deck.

    Realized CLV versus predicted CLV

    Realized customer value is what a customer or cohort has actually produced so far. Predicted customer lifetime value estimates future contribution that has not happened yet.

    Both matter. They answer different questions.

    • Use realized value to audit performance, compare cohorts, and calibrate assumptions.
    • Use predicted value to make forward-looking acquisition, capacity, and retention decisions.
    • Never present predicted value with the certainty of booked revenue.

    Show a range when uncertainty is material. A base case, lower case, and upper case are more honest than a single number calculated to the cent. The further into the future you forecast, the more opportunity reality has to kick your assumptions in the shins.

    For noncontractual businesses, the challenge is even sharper because customers do not formally cancel. They simply stop buying, and you may not know whether they are gone or merely quiet. Fader and Hardie’s RFM and CLV research explains why recency, frequency, and monetary behavior can help forecast future value while distinguishing future-looking CLV from backward-looking customer profitability.

    Why cohort CLV beats one company-wide average

    A cohort is a group of customers sharing a meaningful starting point, source, offer, or characteristic. Cohorts let you compare relationships that began under different conditions.

    Imagine these hypothetical 12-month results:

    Acquisition cohortCustomersAverage revenueAverage contribution before CACAverage CACNet value after CAC
    Referral20$9,000$5,400$500$4,900
    Paid search45$8,400$3,200$1,400$1,800
    Discount promotion70$6,900$1,500$650$850

    These numbers are illustrative, not Scope Design performance claims. Their job is to show why a blended average can obscure the acquisition source, offer, or customer type driving the economics.

    The discount cohort produces the most customers and could make a lead-volume dashboard look busy and important. It also produces the weakest net value. If support capacity is tight, buying more of that volume may make the business worse faster.

    How to calculate customer lifetime value with limited data

    You do not need a data-science department or a machine-learning model that refers to itself as a platform.

    Start with a 12-month realized cohort table.

    Step 1: Choose the decision

    Example: Should we increase spending on paid search for Service A?

    Step 2: Define the cohort

    Customers whose first purchase of Service A came from paid search during the same quarter.

    Step 3: Collect actual revenue and direct relationship costs

    Track revenue collected, refunds, delivery labor, subcontractors, materials, customer-specific software, support, and acquisition cost.

    Step 4: Calculate realized contribution

    Realized contribution = Revenue collected − refunds − incremental delivery and service costs

    Step 5: Compare cohorts and months

    Look for retention, repeat purchase, expansion, margin, and service-cost patterns. Do not rely on one unusually good or catastrophic customer.

    Step 6: Build a conservative forecast range

    Use observed behavior to estimate the next period. Document the assumptions. Include a lower case that assumes weaker retention or higher service cost.

    Step 7: Set the decision rule

    Example: increase spend only if the lower-case 12-month contribution covers CAC, the payback period fits cash flow, lead quality remains acceptable, and delivery has capacity.

    That final sentence is the strategy. The formula supports it.

    What is a good customer lifetime value?

    There is no universally good CLV dollar amount. A good result depends on:

    • customer acquisition cost;
    • gross margin or contribution margin;
    • cash timing and payback period;
    • delivery capacity;
    • retention risk;
    • capital requirements;
    • customer concentration;
    • the reliability of the forecast;
    • the customer’s actual outcome.

    A $50,000 CLV can be bad if it costs $55,000 to acquire and serve the relationship, arrives years later, or depends on miserable delivery. A $5,000 CLV can be excellent if it requires $500 of CAC, pays back quickly, fits the team’s capacity, and produces a strong customer outcome.

    Compare like with like. Revenue CLV should not be divided by CAC and then compared with somebody else’s gross-profit ratio. That is not benchmarking. It is two unrelated fractions wearing matching name tags.

    What is a good CLV-to-CAC ratio?

    The CLV-to-CAC ratio compares expected customer value with the cost to acquire the customer:

    CLV:CAC = Customer lifetime value ÷ Customer acquisition cost

    You will often hear 3:1 described as healthy. Treat it as a rough screening heuristic, not a natural law.

    The ratio is only interpretable when:

    • CLV uses a clear profit or contribution definition;
    • CAC includes the relevant acquisition cost;
    • both numbers describe the same cohort;
    • the time horizon is explicit;
    • payback timing is acceptable;
    • the model accounts for uncertainty;
    • delivery capacity and customer outcomes remain healthy.

    A high ratio is not automatically good. It may mean the business is underinvesting in acquisition, overstating future retention, ignoring service cost, or serving a small set of customers while calling the constraint “efficiency.” A lower ratio may be entirely rational for fast payback, high-confidence retention, or strategically important growth.

    Also track CAC payback period. A promising lifetime ratio does not pay this month’s payroll if the contribution arrives three years from now.

    Five decisions customer lifetime value should improve

    1. Acquisition

    Compare net contribution and payback by source, campaign, offer, and customer type. Do not optimize ads for cheap leads that become expensive customers.

    2. Onboarding and customer success

    Find where early service cost, confusion, or failure predicts poor retention. Improve the handoff and initial outcome. The Scope Design customer-success metric system helps assign an outcome, window, evidence source, owner, and response rule rather than collecting decorative KPIs.

    3. Retention

    Spend retention effort where there is a credible risk signal, meaningful value at stake, and something the business can fix. Do not bribe every customer to stay. A bad-fit customer with negative contribution does not become strategic because the word “retention” sounds wholesome.

    Use the Scope Design loyalty strategy to distinguish earned loyalty from indiscriminate rewards. When the business caused a failure, use the service-recovery process rather than pretending a coupon repairs trust.

    4. Expansion

    Identify customers whose needs and outcomes justify more scope, capacity, or sophistication. Then use the EARNED Expansion Test so the recommendation is based on delivered value, actual need, relevance, transparent numbers, an easy no, and a documented result.

    CLV is not permission to extract the maximum possible invoice from a human being. The customer must receive value too.

    5. Pricing and service design

    If one customer segment consistently requires more support, customization, or risk, change the offer, process, qualification, price, or service boundary. Do not hide structural delivery problems inside an average margin and call the relationship valuable.

    When customer lifetime value is the wrong metric

    Do not force CLV into decisions it cannot support.

    CLV may be premature or misleading when:

    • there are too few customers or too little history;
    • the offer, pricing, or customer definition recently changed;
    • purchases are genuinely one-time and referrals cannot be measured;
    • customer-level revenue cannot be joined to service cost;
    • the business has a technical, traffic, offer, or sales-follow-up failure upstream;
    • one customer dominates the average;
    • the forecast window extends far beyond credible evidence;
    • the decision is primarily constrained by cash, capacity, regulation, or concentration risk.

    In those cases, use simpler evidence: 12-month realized contribution, project margin, repeat-purchase rate, cohort retention, CAC payback, qualified pipeline, or service hours per account.

    The best metric is the one closest to the business outcome that the team can actually influence. The website may create a qualified conversation; it cannot force a prospect to become a profitable five-year customer while the sales and delivery systems take the afternoon off.

    Common customer lifetime value mistakes

    Counting revenue as profit

    This is the classic mistake. It makes high-service, high-refund, or heavily discounted customers look more attractive than they are.

    Using one average for everybody

    Different cohorts have different acquisition costs, margins, retention patterns, and service needs. Segment before acting.

    Treating a forecast as an invoice

    Predicted future value is uncertain. Use ranges, state assumptions, and compare predictions with realized results.

    Adding hypothetical referral value

    Track real referrals and their economics. Do not assign every cheerful customer an imaginary downstream empire.

    Ignoring the time value of money

    For longer horizons or material amounts, discount future contribution. Money received later is not economically identical to money received now.

    Worshipping the 3:1 ratio

    The ratio can be a useful warning light. It cannot replace payback, cash flow, margin, capacity, fit, concentration, or forecast quality.

    Retaining customers at any cost

    Some relationships should be repaired. Some should be redesigned. Some should end cleanly. Lifetime value is not an instruction to keep every account forever.

    Measuring without assigning a response

    If a change in CLV produces no action, owner, or decision rule, stop spending hours polishing it.

    A practical CLV dashboard

    Keep the first version boring enough to trust.

    For each cohort, show:

    • cohort definition and start date;
    • number of customers;
    • realized revenue;
    • refunds and credits;
    • delivery and support cost;
    • realized contribution;
    • acquisition cost;
    • net value after CAC;
    • repeat-purchase or retention rate;
    • forecast window and assumptions;
    • predicted contribution range;
    • payback period;
    • forecast error when the period closes;
    • owner and decision rule.

    Review the model on a schedule that matches the buying cycle. Weekly analysis is absurd for a business whose customers purchase once a year. Annual review is equally useless for a monthly subscription hemorrhaging customers now.

    The bottom line

    Customer lifetime value is not the total amount you can squeeze from a customer before they escape. It is a model for understanding the economics of creating and sustaining a useful customer relationship.

    Calculate contribution, not fantasy revenue. Compare cohorts, not a vague company average. Use an explicit time window. Name the decision. Audit the prediction. Protect customer outcomes, delivery capacity, and cash flow while you do it.

    If your CLV model cannot tell you what to do differently on Monday, it is not intelligence. It is arithmetic wearing a lanyard.

    If you need help connecting acquisition, website behavior, sales handoffs, delivery cost, retention, and customer value into one operating model, Scope Design’s Impact Consulting starts with the constraint and the business decision, not a preselected deliverable.

    Frequently asked questions about customer lifetime value

    What is meant by customer lifetime value?

    Customer lifetime value is the expected economic value a customer will create over a defined relationship period. A useful CLV model states whether value means revenue, gross profit, contribution, or discounted future profit and identifies the customer cohort it describes.

    How do you calculate customer lifetime value?

    For repeat purchases, a basic formula is average purchase value multiplied by purchase frequency and customer lifespan. For business decisions, improve it by using gross margin or contribution after service costs, defining a time window, segmenting customers into cohorts, and comparing the forecast with realized results.

    What is the formula for customer lifetime value?

    A common revenue formula is average purchase value × purchase frequency × average lifespan. A common gross-margin formula is average revenue per period × gross margin percentage × expected lifespan. Service businesses often need a contribution model that subtracts incremental delivery and support costs from expected revenue.

    Are CLV and LTV the same thing?

    Usually. CLV, CLTV, customer LTV, and LTV are often used interchangeably. The more important question is what the calculation includes: revenue, gross profit, contribution, acquisition cost, discounting, cohort, and time horizon.

    What is a good customer lifetime value?

    There is no universal good dollar amount. CLV is good only relative to acquisition cost, margin, payback timing, cash flow, delivery capacity, forecast confidence, and the customer outcome. Compare similar customer cohorts using the same definition.

    What is a good CLV-to-CAC ratio?

    A 3:1 ratio is a common rough heuristic, not a universal standard. The ratio is meaningful only when CLV is profit-based, CAC is complete, both numbers describe the same cohort and time horizon, and payback, capacity, and uncertainty are acceptable.

    Should customer lifetime value use revenue or profit?

    Use revenue CLV only for a simple descriptive view. Use gross profit or contribution CLV for acquisition, retention, pricing, and service decisions because revenue ignores the cost required to create it.

    Should customer acquisition cost be included in CLV?

    Keep a pre-CAC contribution CLV and CAC visible separately so you can compare acquisition sources. You can then calculate net customer value by subtracting CAC. Whatever approach you use, label it clearly and do not compare ratios built from different definitions.

    How do you calculate CLV when there is no subscription?

    Use customer purchase history to model recency, frequency, monetary value, repeat-purchase probability, margin, and a defined forecast window. Because noncontractual customers do not formally cancel, use conservative ranges and compare predicted value with realized cohort results.

    Can a high-revenue customer have low lifetime value?

    Yes. Heavy support, customization, discounts, refunds, slow payment, rework, travel, and senior labor can consume the apparent value. Revenue-based CLV can make two customers look equal even when their contribution is dramatically different.

    How often should CLV be recalculated?

    Recalculate on a cadence that matches the buying cycle and whenever pricing, service delivery, acquisition channels, or customer behavior materially change. Always compare prior predictions with actual cohort results before updating the model.

    What is realized customer lifetime value?

    Realized value is the revenue or contribution a customer or cohort has actually produced to date. It is historical evidence. Predicted CLV estimates future value. Use realized results to calibrate and challenge the prediction.

    Why should CLV be calculated by cohort?

    Cohorts reveal differences hidden by one company-wide average. Customers acquired through different sources, offers, periods, or service tiers can have different margins, retention patterns, support costs, and payback periods.

    When should a business not use CLV?

    Do not rely on CLV when data is too thin, the business model recently changed, customer costs are unavailable, one customer dominates the average, or the forecast is more speculative than useful. Start with realized contribution, project margin, repeat purchase, retention, or CAC payback instead.